Testing and Debugging
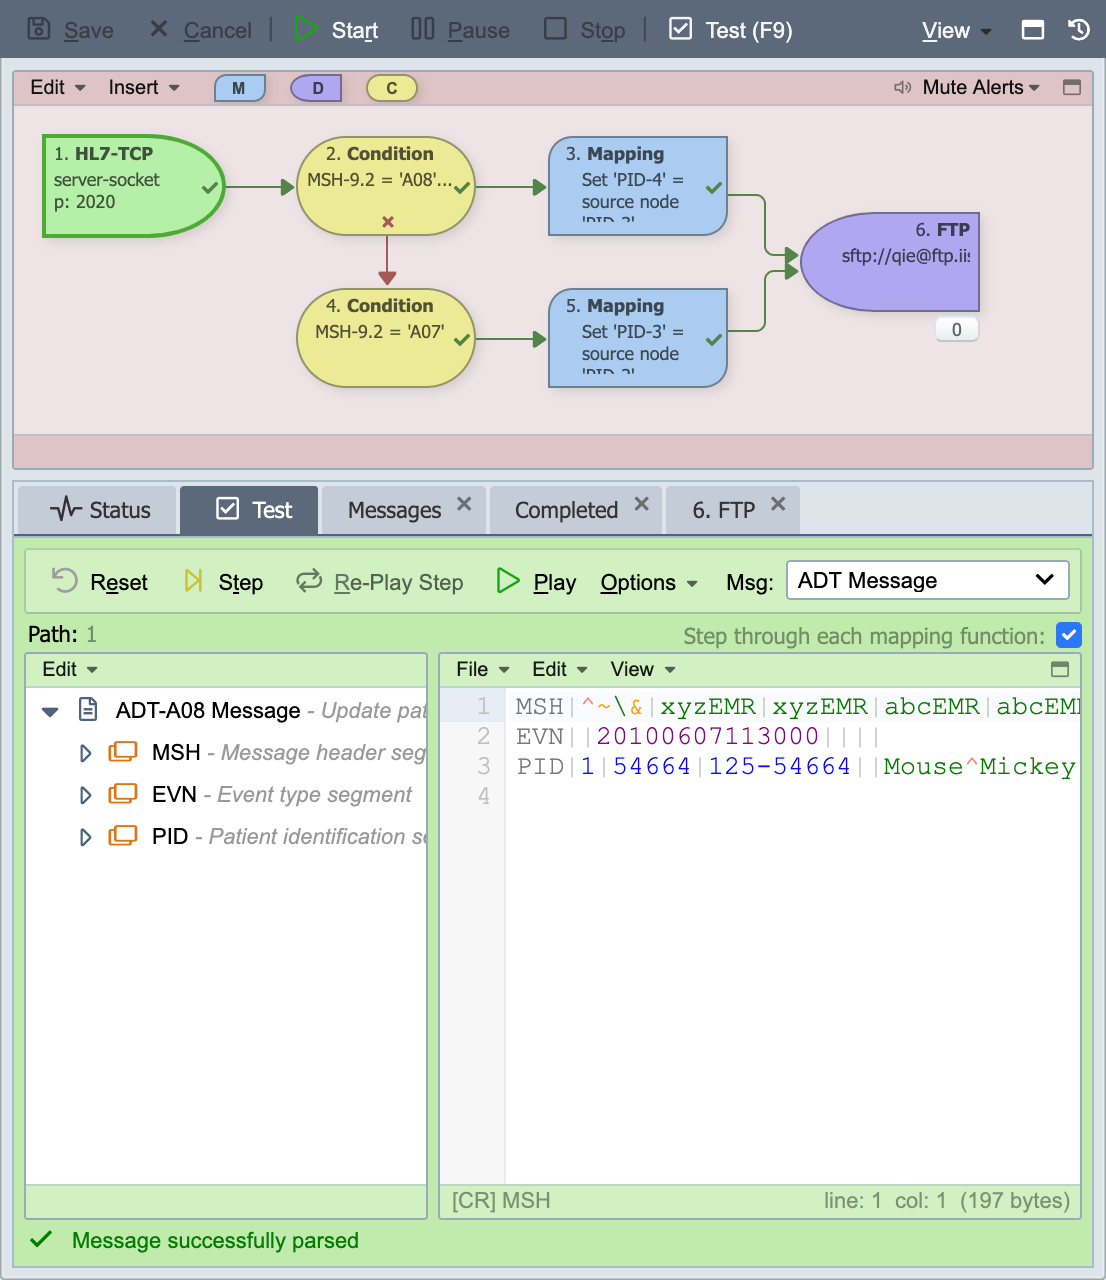
The Channel Test tab lets you step a sample message through the channel one node at a time, or play it through the whole channel, to see how the channel processes real messages, without having to save the channel configuration first.
| Node type | Behavior in test mode |
|---|---|
| Source | Parses the sample message but does not actually receive from the external source. |
| Mapping | Executes normally, including any external calls the script makes (database queries and updates, web service calls, etc.). |
| Condition | Executes normally, including any external calls the script makes. |
| Destination | Not transmitted. The test signals that the message reached the destination but does not actually send. |
Note
Mapping and condition scripts execute normally during testing. Any database queries, updates, or web service calls in those scripts run against the configured connections.
Scheduled scripts run during a test, but their output stays in the test
Before it steps the message, a test run first executes any of the channel's before channel starts scheduled scripts that are marked to run in the test window. Their qie.debug/info/warn/error output appears in the Test Log rather than the channel log, and a qie.error(...) in one of them does not raise a channel error alert. Run Now follows the same rule. If such a script fails, whatever it logged before the failure is included in the error that is reported.
More generally, nothing a test run produces is written to the channel's Status log: a test message is not a message the channel is processing. Slow-query and slow-database-connection warnings, web service failures, and preprocessor and error-handler output all appear in that run's Test Log instead. They are still recorded in qie.log.
This is the right environment for verifying mapping logic, condition routing, and source-format parsing before you save and start a channel. Access it from the Channel page by selecting the Test tab next to the channel status tab, clicking the Test button on the visual channel editor toolbar, or pressing F9.
As a message is stepped through the channel configuration, the active node is highlighted in green in the visual channel editor and the test panel color is updated to match the active node.
The status of the last step executed is displayed at the bottom of the test tab. A green check mark indicates that the last step executed successfully. A red X indicates that the last step failed.
Test Panel Toolbar
Testing execution is managed using the controls on the test panel toolbar.
Reset
The reset button restores the test message to its original state, and reset the test process back to the beginning of the channel (the source node).
Step
The step button executes the next step in the channel (next node, next mapping function, etc.) and then wait for further user input.
Play
The play button plays the message through the channel configuration, one step at a time, momentarily displaying the results of each step before proceeding to the next step.
Re-Play Step
The replay step button allows the user to make a change to the code and replay only the current step. This saves time when troubleshooting as the message skips all of the previous mappings.
Options
Speed
This drop-down list controls the play speed or the duration of the pause between steps.
Show tree View
This toggle option shows or hides the tree view of the message being tested.
Note
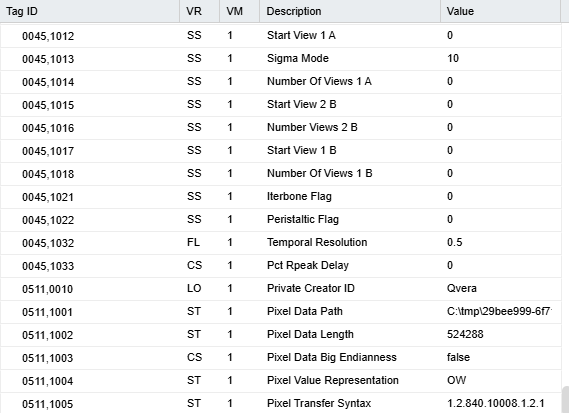
For DICOM messages, each tag in the tree view is labeled with its keyword (for example, (0010,0020) is shown as Patient ID). Tags in a private group are resolved through the tag's private creator, so elements published by recognized vendors such as Siemens and Philips display their defined keyword instead of a generic Private Tag label. Private tags whose keyword cannot be resolved (an unrecognized private creator, or an element that is not individually named in its dictionary) are labeled Private Tag.
Recognized private tags display their keyword:
Limit Spawned
The number of spawned messages can be limited from the first 10 to the last 100.
Message
The message drop-down list contains a list of the Sample Messages associated with the channel. Selecting a new message from the drop-down list places that message in the test panel. Messages from the Error, Message and Completed tabs can also be selected for testing. If a message is selected from one of the channel tabs, a button to save the message as a sample displays. Selecting this option saves the current message as a sample message to facilitate testing and debugging.
Step through each mapping function
When this option is selected, each mapping function is executed independently, allowing the results of the mapping function to be evaluated. When not selected, all mapping functions associated with a mapping node are executed in a single step.
Source Node Test Panel
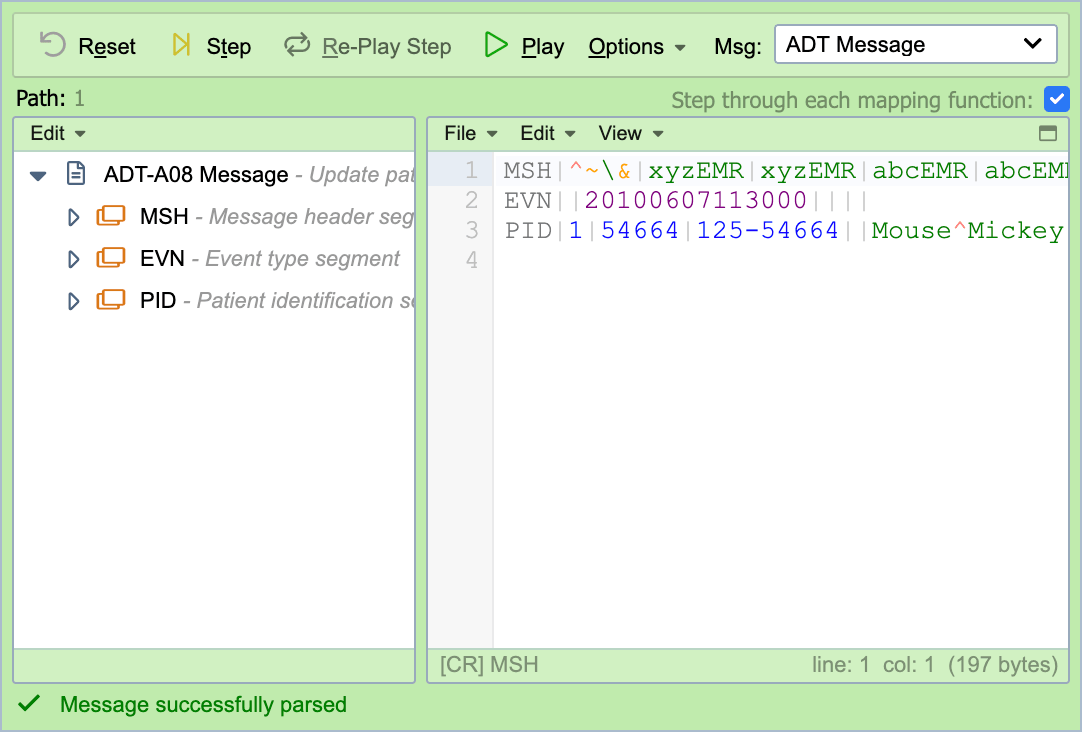
The source node test panel is the first panel displayed during testing. Executing the source node (by clicking Step or Play) parses the current sample message based on the source format and displays the result. If the sample message fails to parse correctly, an error message is displayed, and the testing process is terminated. The sample message can be modified from its original state in this panel. If it is modified prior to executing the source node, the test panel uses the modified version of the sample message for the duration of that test. The top left corner of the panel displays the current node, and the bottom left corner displays the status of the step.
Condition Node Test Panel
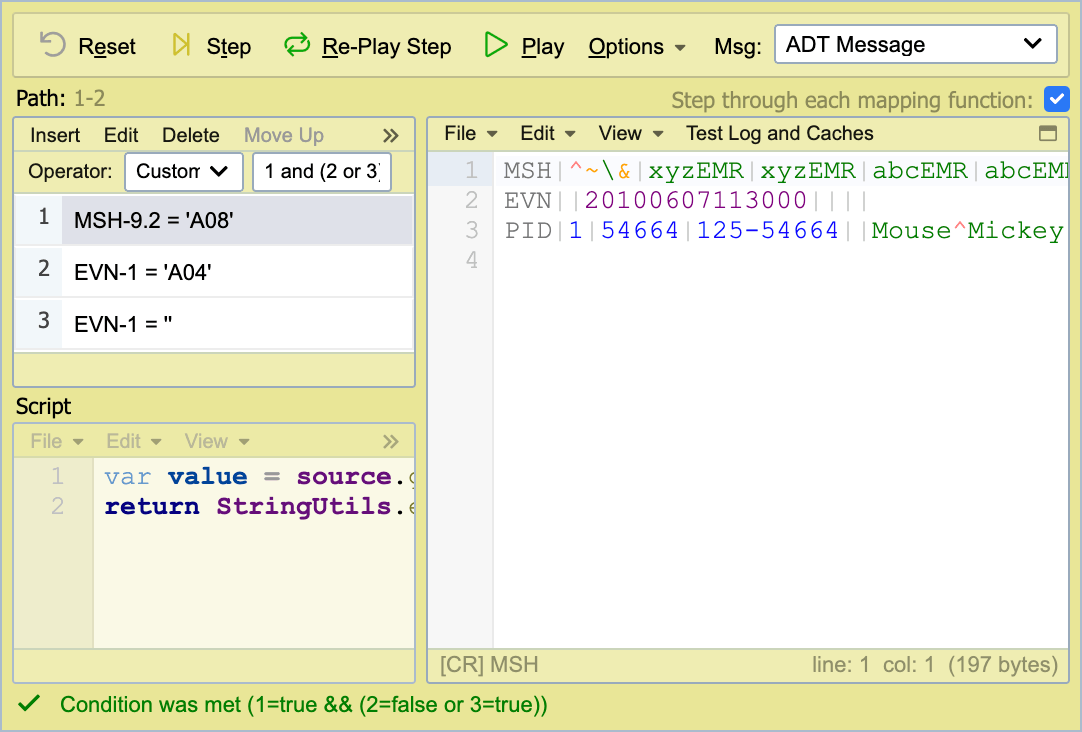
The condition node test panel is displayed when a condition node is the active node.
The condition items are displayed in this panel in the upper left section of the panel.
The script associated with the currently selected condition item is displayed in the lower left section of the panel.
Executing a condition node executes the associated condition and return the result. If the condition is met, the message continues to the attached pass node (or nodes). If the condition is not met, the message continues to the attached failure node (or nodes). If the condition is not met and there are no fail nodes attached, the message is sent to the error queue.
Mapping Node Test Panel
The mapping node test panel is displayed when a mapping node is the active node.
The mapping function list is displayed in the upper left section of the panel. Double-clicking a mapping function opens the mapping function dialog for editing, allowing you to edit a function and then use Re-Play Step without leaving the testing window. The script associated with the currently selected mapping function is displayed in the lower left section.
The state of the message before the last step executed is displayed in the upper right section, and the state after the last step is displayed in the lower right section.
The Test Log, Caches and Script Variables menu, accessed from the lower panel, displays any log messages along with the message cache, channel cache, shared cache, and script variable values that have been added.
Entries produced while a message is being processed are prefixed with the branch that produced them, as [path=1-2] -. On a channel that fans out to more than one destination, this is what tells you which branch a query, request, response, or script log line belongs to. Entries logged before the message exists have no branch and carry no prefix: the preprocess script, scheduled scripts run in the test window, and the framework's own progress lines.
Executing runs either the next mapping function or the entire mapping (depending on the test panel configuration) and displays the results. The last mapping function executed is selected in the mapping function list.
Destination Node Panel
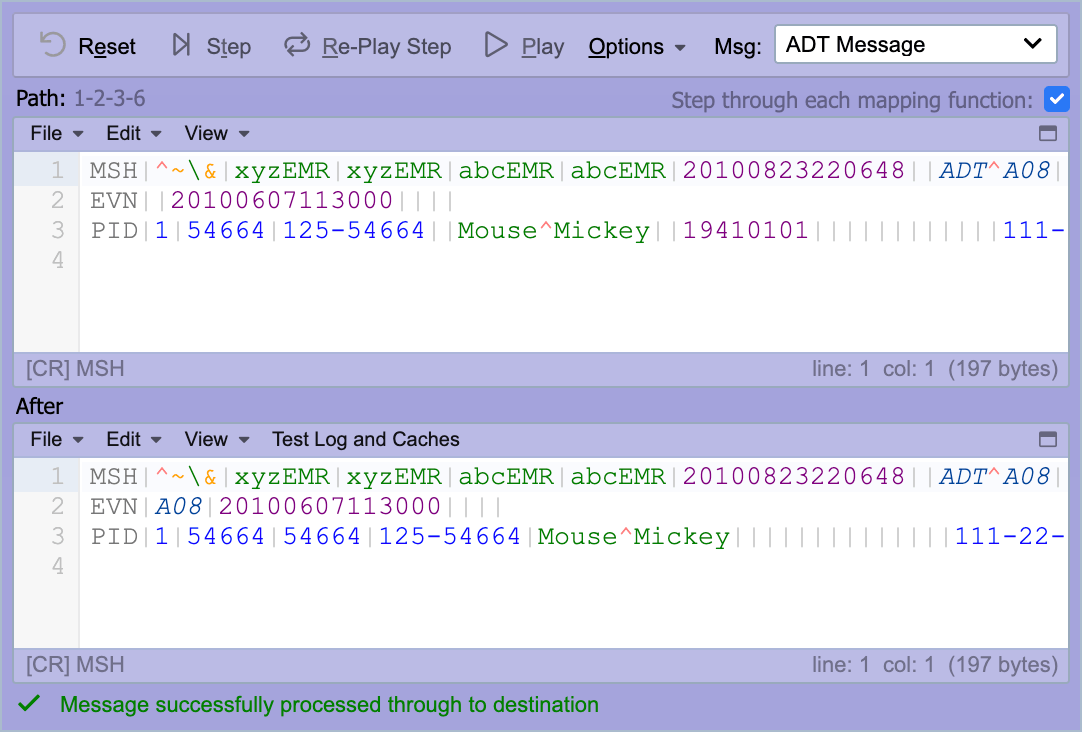
The destination node panel is displayed when a destination node is the active node.
Because data should not be sent during testing, the destination node does not actually test the destination. Instead, it signifies that the message has successfully processed through the channel configuration and reached a destination node.
The original message is displayed in the upper section of the panel.
The modified or mapped message (which would be sent to the destination) is displayed in the lower section of the panel.
Testing a Channel End to End
The Test panel does not transmit to destinations. It confirms that a message reaches a destination node but stops short of sending it (see the table at the top of this page). To exercise a destination and the downstream system it sends to, send a real message through the channel's source node.
You can send a test message through a source at any time; the channel does not need to be stopped. The test message is processed alongside whatever other messages are arriving at that source. How you inject a message depends on the source type:
- File or Network Share: Place a test file in the configured inbound folder on the QIE server. The path is on the server, not your workstation, unless QIE is installed locally. For a Manual or Scheduled source, use the Run Now button to pick it up immediately.
- Socket (HL7 MLLP): The source node listens on a port on the QIE server. Send a test message to that host and port using whatever method suits your environment.
- Custom Script Receiver: Set execution to Manual or Scheduled and use the Run Now button.
To re-send a message the channel has already processed, use the Resubmit button on the message history. It copies the message back into the inbound queue.
Test Socket needs a free port; sending a message does not
Sending a test message to a running socket receiver always works. You connect to its listening port as a client and the message is processed along with everything else. What you cannot do is open a second listener on that port, which is exactly what the Test Socket button attempts. If you run it against a channel that is already listening, it reports the port as in use and names the channel holding it. Use Test Socket before the channel starts to confirm the port is free to bind; it is not needed to send a message into a running receiver.