View Endpoints
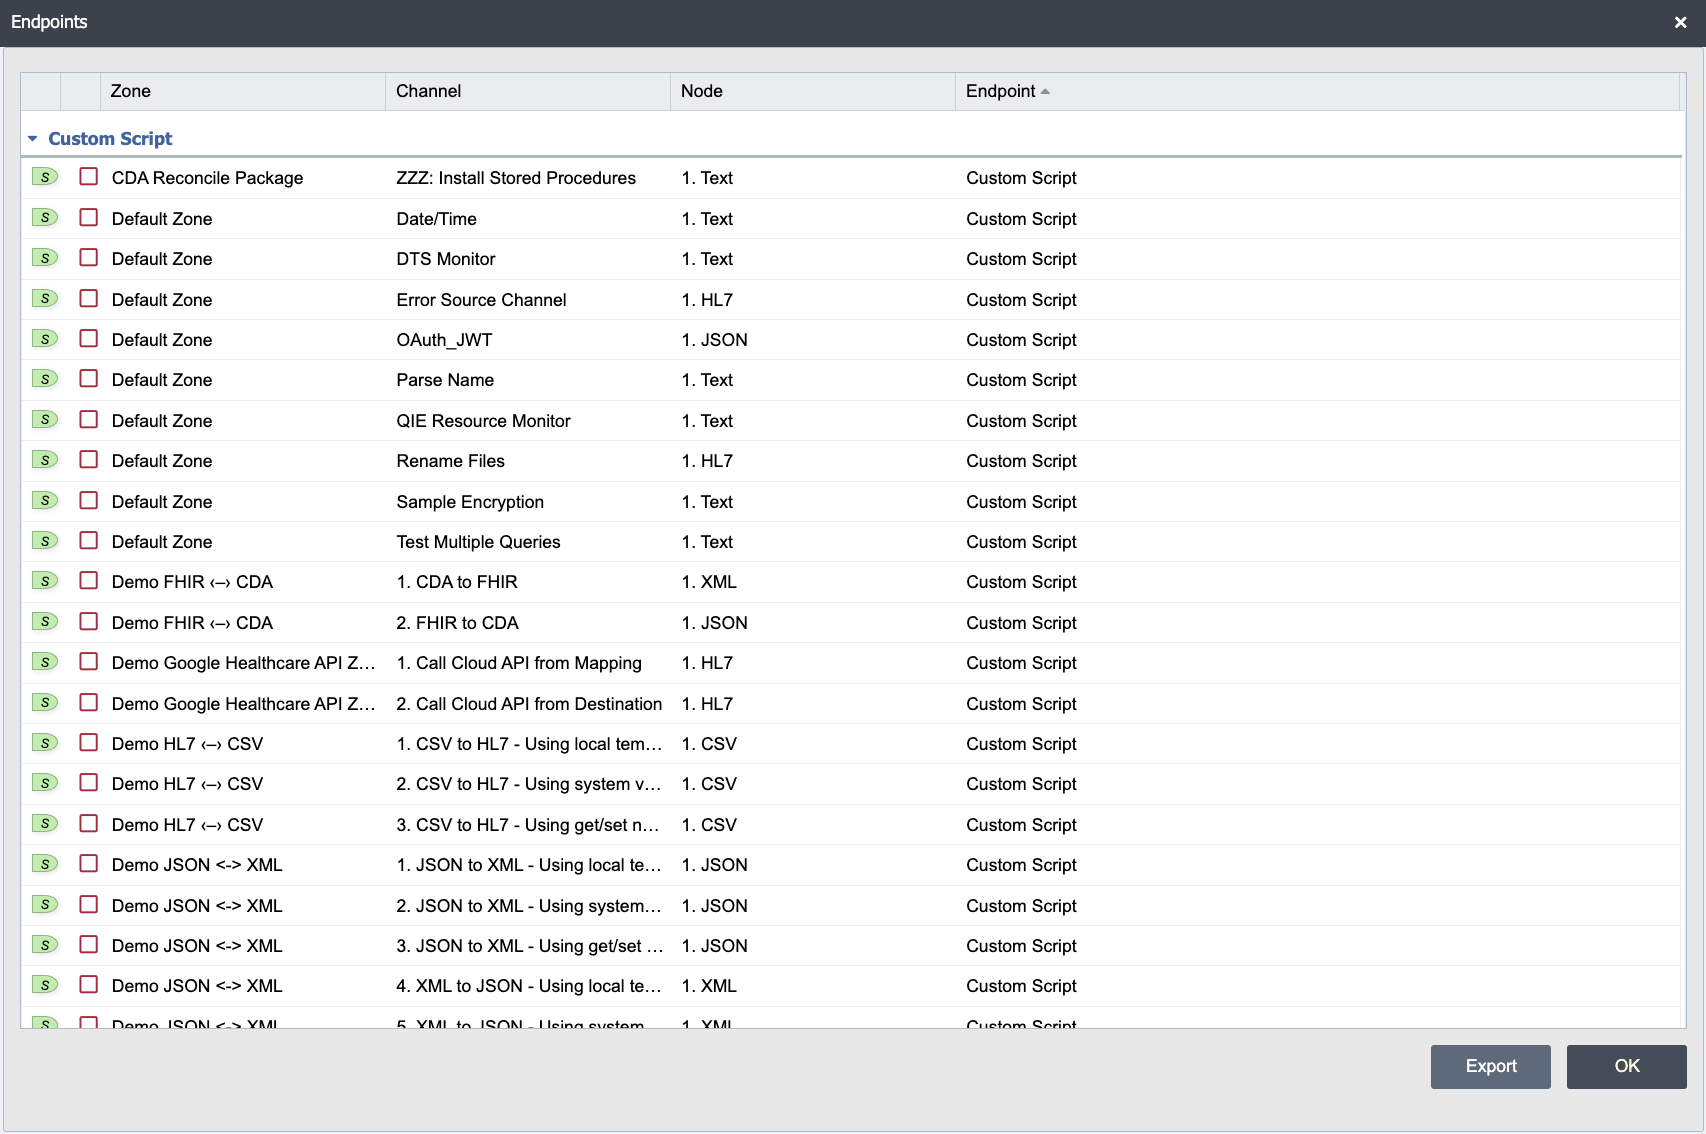
View Endpoints flattens every source and destination endpoint across the entire QIE installation into a single grid grouped by transport type. It answers questions that neither Global Search nor Find Usages can: what is talking on which port, which channels listen on a given hostname, how many SFTP destinations point at a retired host, without trawling channel by channel. Open it from the header's View menu: View -> View Endpoints.
The grid lists one row per source (receiver) and one row per destination node, excluding Discard destinations. Channels with multiple destinations contribute multiple rows. The dialog title is Endpoints.
What each row shows
Each row has these columns:
- Source / Destination icon: direction indicator. Source = receiver; Destination = outbound sender. Hovering names the direction and reminds you that double-clicking the row opens the channel.
- Channel status icon: running, paused, stopped, errored, or disabled. Hovering names the state in words. A disabled channel reports itself stopped internally, so it is shown as Disabled rather than Stopped to match the Channels page.
- Zone: the zone the channel lives in.
- Channel: the channel's display name.
- Node: a description of the source or destination node (for example, the receiver type or destination type).
- Schedule: how often the endpoint runs. Destinations always show Real-time, because a destination sends as soon as a message reaches it. Sources show Real-time unless the receiver type polls on a schedule, in which case the value reflects the receiver's Execution setting.
- Endpoint: the connection-level description: hostname, port, file path, URL, queue name, etc., depending on transport type. A receiver row shows what it listens on or polls; a destination row shows where it sends.
127.0.0.1is normalized tolocalhostso loopback endpoints group consistently. Shown only to a user who can manage or edit the zone; see Permissions below.
Polling receivers (Custom Script, Database, File, FTP, Network Share) show one of these Schedule values:
| Execution setting | Schedule column |
|---|---|
| Continuous | Every XX ms (YYs), where XX is the interval the engine will poll at and YY is the same value in seconds. This is the effective interval, not always the configured one. A receiver with no interval set polls every 500 ms. An FTP receiver never polls faster than 5000 ms and a Network Share receiver never faster than 500 ms, so a shorter configured value is reported at that floor. |
| Scheduled | The receiver's cron string, exactly as it was entered. |
| Manual | Manual |
Every other receiver type is driven by an inbound connection rather than a timer, so it shows Real-time.
Rows are grouped by endpoint type (Database, FTP, File, HTTP Listener, Script, Secure Socket, Socket, Web Service) and each group can be collapsed or expanded with the toggle to the left of the group header.
Double-click any row to navigate to the channel's source or destination node.
Permissions
The listing covers only the zones the logged-in user can reach. A zone the user can neither view nor manage errors for contributes no rows at all, the same way it is absent from the zone list and the navigation tree. A user who can only manage a zone's errors sees its endpoints the same way a viewer does, since they already reach those channels to work the error queue.
The Schedule and Endpoint columns are held to a higher bar than the rest of the row. They carry node configuration, so a user must be able to view the zone and to manage or edit it before either shows a real value. A user who can only view a zone, or only manage its errors, reads Hidden in both. Hovering over Hidden shows the tooltip Insufficient permissions to view detail. Alert permission grants nothing here on its own.
Package locks apply on top of zone permission. A source or destination node in a locked package whose package configuration is neither viewable nor editable reads Locked for every user, including one who can edit the zone. Hovering over Locked shows the tooltip In a locked package that hides its configuration. The channel editor replaces that node's detail panel with a locked panel, and the Schedule and Endpoint columns apply the same bar. Unlocking the package restores the value. Because the bar is applied per node, a channel can show a real endpoint for one destination and Locked for another. A database receiver, and a database, web service or DICOM destination, take their endpoint from the connection they point at rather than from the node, so those read Locked whenever that connection sits in a locked package, even when the channel itself belongs to no package at all. Where a user also lacks the zone permission those columns read Hidden, since permission is checked first.
Export
The Export button downloads the entire endpoints list as a CSV file, preserving whatever sort order is currently applied in the grid. This is useful when you want the list in a spreadsheet, for a compliance audit, a migration checklist, or a diff against an older snapshot.
The exported Status column carries the same word the status icon's tooltip shows, including Disabled.
The same content is available programmatically through the Management API at /engine/downloadEndpoints. See Engine Endpoints.
Common audit examples
- Inventory all inbound listening ports. Filter visually to the Socket, Secure Socket, and HTTP Listener groups. Each row's Endpoint column has the port.
- Find every destination pointing at a host you plan to retire. Sort by Endpoint and scan for the hostname, or use the Export button and grep the CSV.
- Check for duplicate listeners. Two source rows in the Socket group with the same port and host generally indicate a misconfiguration unless the receivers are in different zones for intentional segmentation.
- Confirm a channel was retired. A channel that should be gone but still appears in this dialog still has a source or destination wired up.
When to use View Endpoints vs other inspection tools
- View Endpoints: what endpoints exist, and what is each one? Use when the question is shaped by transport (ports, hostnames, file paths).
- Global Search: where does this literal text appear in the configuration? Use when the question is shaped by a string value (function name, hostname embedded in a script, system variable name).
- Find Usages: what references this specific saved object? Use when you already have the object (a connection, a variable, a published function) and need its consumers.
The three are complementary. A typical pre-retirement audit might use View Endpoints to confirm a host is referenced, Global Search to find script literals that mention the host's name, and Find Usages on the matching connection to confirm every channel that calls through it.