Global System Status
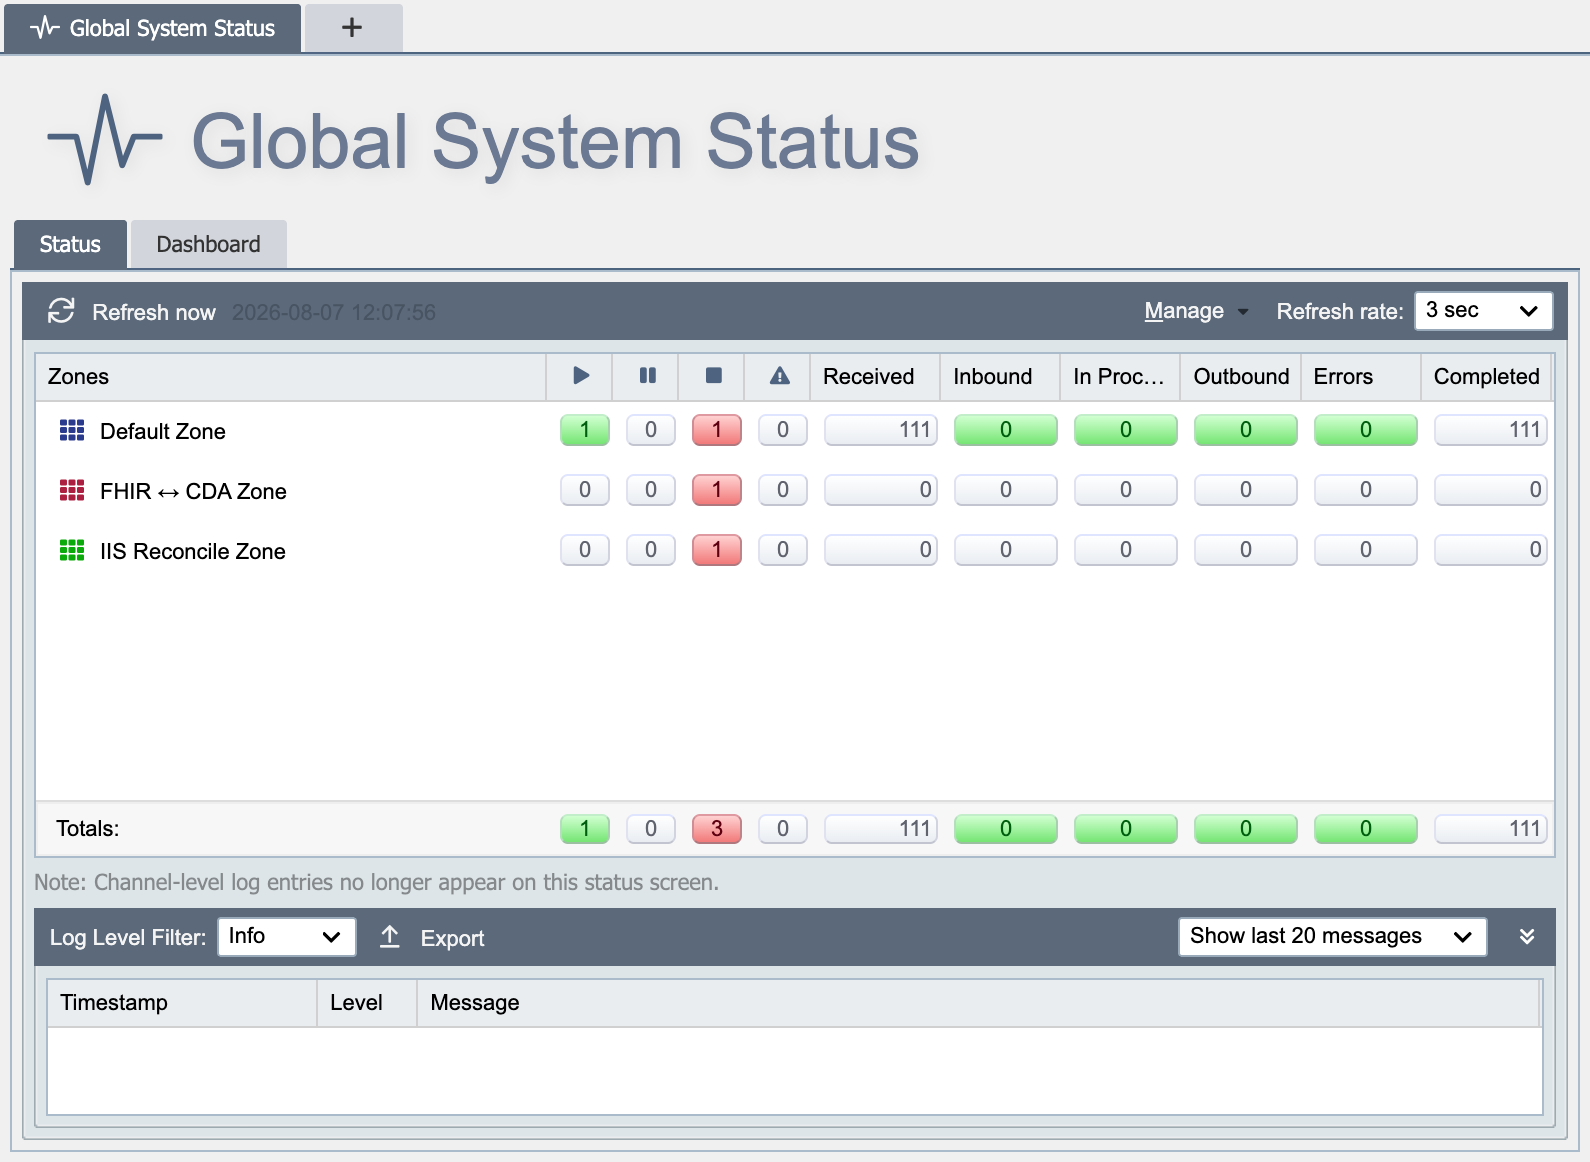
The Global System Status displays the current status summarized by zone:
The screen refreshes automatically based on the Refresh rate, which can be modified on the top right corner of the panel. There is also a Refresh now button to refresh the screen immediately. The Manage button allows a user to stop, start or pause all channels in all zones.
Status Summary Panel
The status summary panel contains 1 row for each zone and displays the number of channels in each state (running, paused, or stopped), as well as the counts for each of the message queues for the given zone. The time of the last message received by the channel and the last error are also displayed. Clicking on the row displays the Zone Status. The zone context menu can be accessed by right-clicking on the row. This context menu allows you to start, pause or stop all channels for that zone.
Log History Panel
The system log panel contains a list of the most recent log entries across all zones. The Log Level Filter can be changed here to view log messages at a different level than the default of info (see Channel Log Level for more information). Log messages from all zones can be exported from this panel, see Exporting Log Messages.
Log Level Filter
The Log Level Filter drop-down changes which log entries are displayed in the history panel. It accepts the same log levels you can configure on the channel itself (see Channel Log Level for more information).
Note
Changing the Log Level Filter does not change the log level. It simply changes (or filters) the log messages which are displayed in the log history panel. If the log level is set to 'Info', 'Debug' level messages are NOT generated, even if 'Debug' is selected in the Log Level Filter drop-down list.
Dashboard
A second tab on the Global System Status page, Dashboard, displays historical message-traffic charts. By default it overlays the current month's message counts with the previous month's data, providing a quick at-a-glance view of usage trends.
Click Filters on the toolbar to narrow what the chart shows:
- License Group: filter by license group
- Zone: filter to one or more zones
- Channel: filter to specific channels
- Time frame: change the period the chart covers
An Export button on the right side below the chart writes the chart data to a file so it can be archived or shared.
Use the Dashboard for usage reporting (monthly volumes by zone or channel, capacity-planning conversations). The Status Summary tab on the same page covers real-time monitoring.