Exporting Log Messages
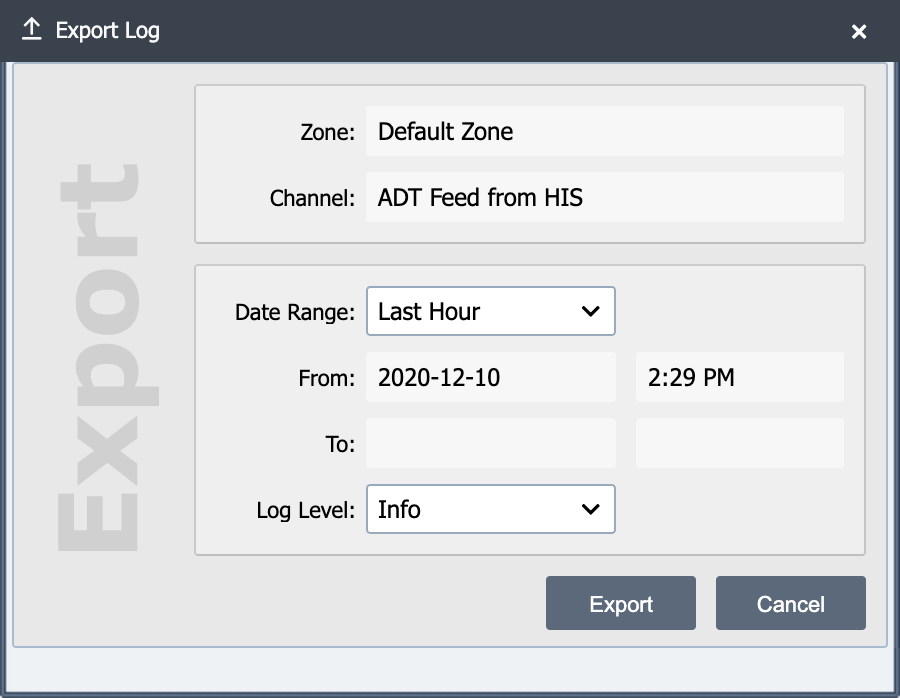
In addition to viewing the most recent log messages, historical log messages for a given time period can be exported to a text file by selecting the Export button from Global, Zone or Channel log history panel.
Export Log Messages Dialog
Zone
When exporting messages from the Zone Status, only log messages associated with the specified zone are exported. To export messages for all zones, select the Export button from the Global Status Page.
Channel
When exporting messages from the Channel Page, only log messages associated with the specified channel are exported. To export messages for all channels, select the Export button from either the Global Status Page or Zone Status.
Date Range
A date range must be specified when exporting log messages. The date range drop-down list contains commonly used date ranges that, when selected, set the appropriate From date/time and To date/time values.
From and To
When specifying a custom date range, the From and To date/time values must be specified.
Log Level Filter
The log level drop-down list is used to filter log messages to be exported. The log levels listed correlate to the log levels that can be defined for each channel (see Channel Log Level for more information)
Server Resources Dialog
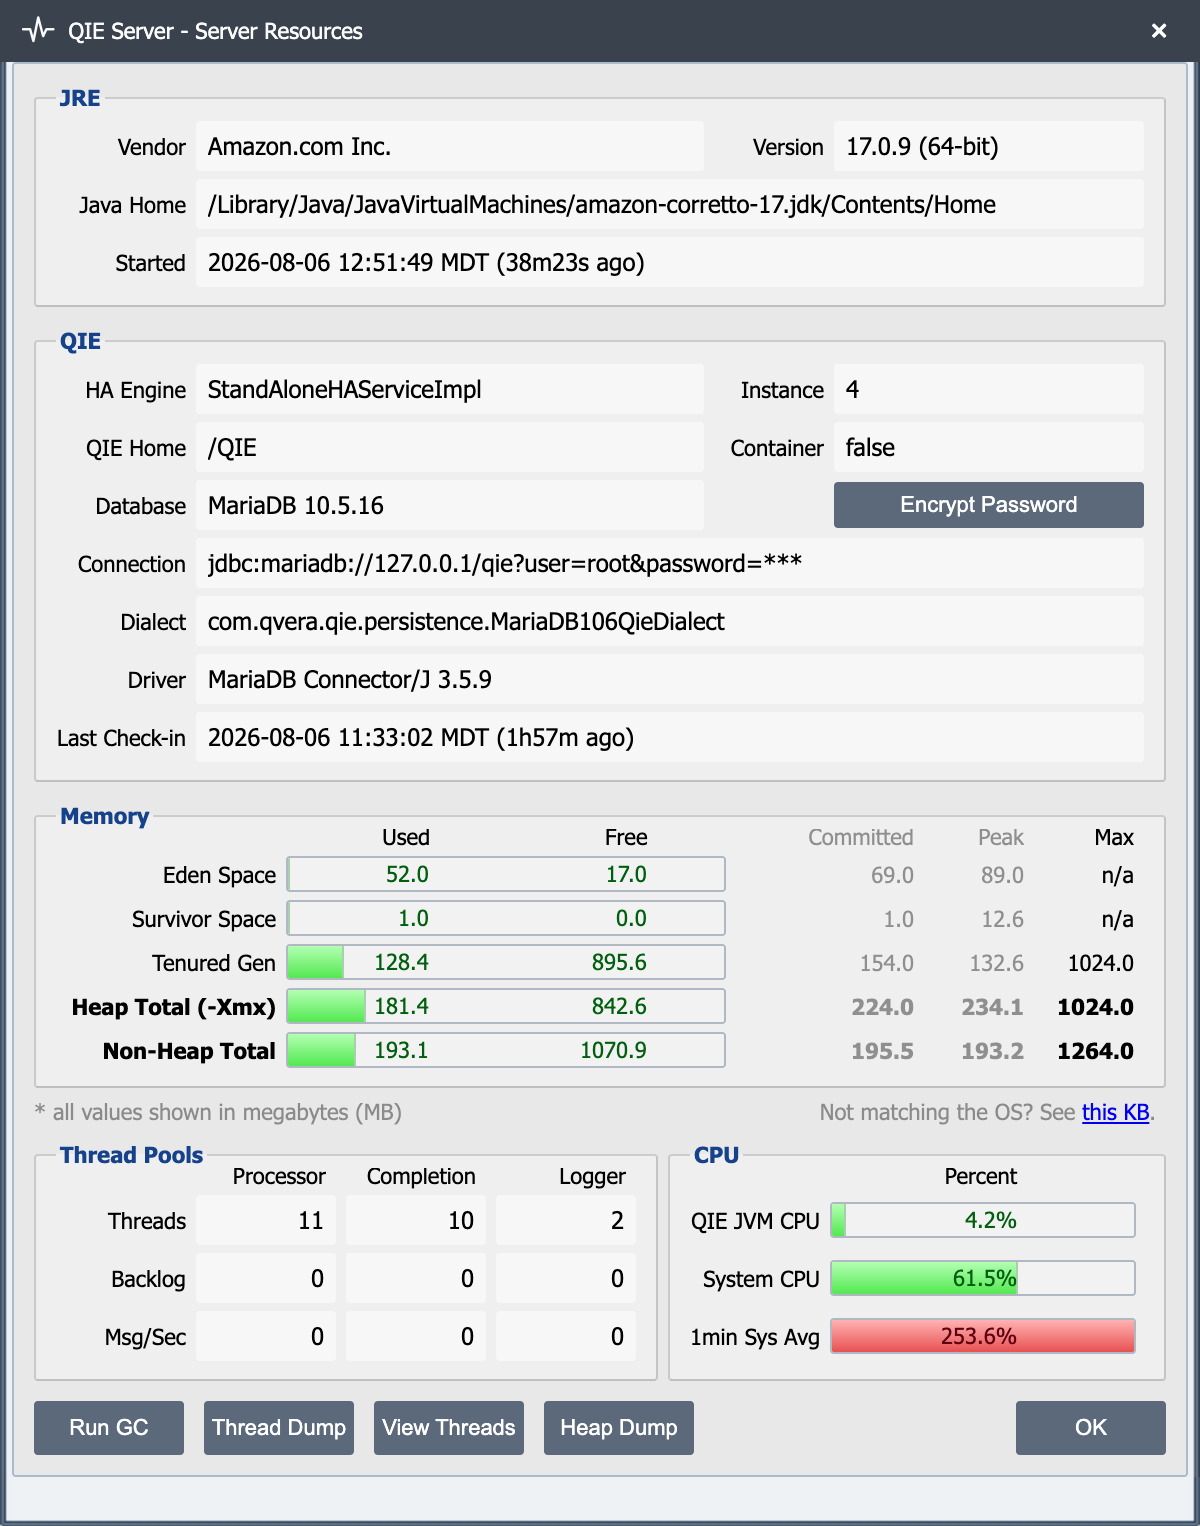
The QIE Server Resources Dialog can be accessed by selecting Help -> Monitor Server Resources from the main menu.
JRE
This section contains information about the java runtime environment which is being used by QIE and the date and time of when QIE was last started.
QIE
This section contains high level information about how QIE is configured.
Heap
On startup, the application allocates a specified amount of memory called the Heap (or free store). The heap is the total amount of memory used for dynamically allocating objects to memory. As the system runs QIE allocates and de-allocates (called Garbage Collection) memory for objects as needed. There are three main memory spaces in Java Called Eden, Survivor, and Tenured. Objects are assigned a memory space based on their life span. Hence they are also referred to as generations. An object is considered garbage when it can no longer be reached from any pointer in the running program. Garbage Collection is automatically performed by Java. Objects in the Eden Space are cleaned up without a lot of overhead, whereas objects in the tenured space take more overhead and time to clean up. As a general rule, you would expect to see the most used space in the Eden Generation Space.
Eden Space
All new objects are initially allocated in memory in the Eden Generation Space memory pool. These objects are usually messages that flow through the system and have a short life span. Some other examples of objects in the Eden space would be the items such as the Message Cache. More permanent objects after being around for a while move to the Survivor Generation Space and then eventually to the Tenured Generation Space.
Survivor Space
The survivor generation space is where objects that have been around for a long time but not cleaned up in the Eden Space perhaps because they are still in use move to the Survivor Space and if they continue to stay around, they move to the next level called Tenured Generation space.
Tenured Gen
Objects that have been around for a very long time live in the Tenured Generation space. These objects may be Channels, Global System Variables, Database Connections, etc.
Red bars are not a warning
Red on the Eden Space and Survivor Space bars simply means the space is near full and Java's garbage collector is about to run on it, which is normal and expected. Eden cycles through fill-and-collect constantly during message processing. The bar to watch for sustained memory pressure is Tenured Gen: persistently high usage there means long-lived objects are accumulating and may indicate a leak or the need for a higher -Xmx.
Heap Total
This shows the total amount of memory allocated to the QIE Java process.
Note
This dialog reports JVM heap only; the OS shows a larger footprint because of JVM native memory not counted here. A multi-hundred-megabyte to multi-gigabyte gap above -Xmx is normal. Provision host RAM above -Xmx and never set -Xmx to total physical RAM.
Thread Pools
Current number of processor threads in use by QIE. For more information see Thread Pools.
Run GC button
Selecting the Run GC button attempts to run a JVM garbage collection to release any objects from memory that are no longer being used.
Thread Dump/Heap Dump
The Heap Dump button writes a snapshot of the JVM heap to qie.hprof in $QIE_HOME. Open the file with a heap analyzer (Eclipse MAT, IntelliJ's profiler, etc.) to investigate memory usage. The Thread Dump button writes the current state of every JVM thread to the QIE log, useful for diagnosing hangs or deadlocks.
To capture a heap dump automatically when the JVM runs out of memory, add the following JVM options on the QIE Service Manager's Startup tab:
When set, an OutOfMemoryError writes an .hprof file to the configured path before the JVM exits.